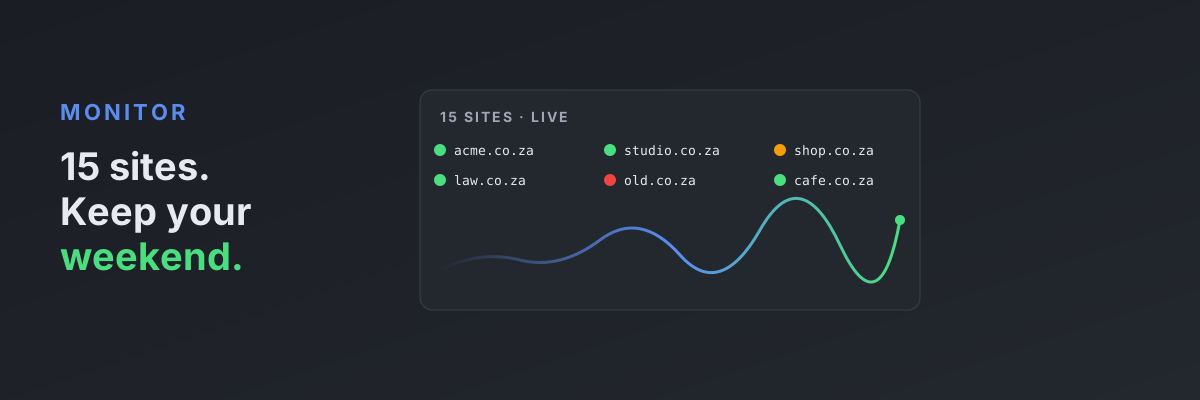
The pattern is familiar to every small agency. You build a site for a client, hand it over, and move on to the next project. Six months later the client phones on a Saturday morning because their site is down, or because Google has dropped them off page one, or because their SSL certificate quietly expired three days ago. You spend the weekend fixing something that proper monitoring would have flagged a week earlier.
The problem is not that monitoring tools do not exist; there are dozens. The problem is that most of them either cost too much to run across 15 client sites, drown you in irrelevant alerts, or require so much setup that you never quite get round to it. What follows is a low-overhead approach that works for agencies with anywhere from five to fifty active client sites.
What actually matters
Not everything needs alerting. A perfectly green dashboard tells you nothing. A dashboard that fires alerts for every minor blip teaches you to ignore it. The goal is to catch the failure modes that genuinely require action, before the client notices.
For a typical small business website, the failure modes that matter are:
- The site is down or unreachable. Obvious, but you need to know within minutes, not days.
- The SSL certificate is days from expiring. AutoSSL fails silently more often than people realise. A 30-day-out alert gives you time to investigate.
- Core Web Vitals have regressed. Usually after a plugin update, a new theme, or someone uploading a 5 MB hero image to a blog post.
- The site has dropped out of Google's index. Easy to miss until someone notices the traffic has fallen off a cliff.
- Security headers or HTTPS configuration have changed. A staging copy accidentally promoted to production. A new plugin breaking CSP. A redirect chain pushing search engines off the site.
That is roughly the right list. Anything more granular is noise.
The three-layer setup
Layer 1: Uptime
Use a dedicated uptime monitor. UptimeRobot's free tier covers 50 monitors at 5-minute intervals, which is plenty for most agencies. Set up one HTTP monitor per client site, alerting to a single Slack or email channel. Down for two consecutive checks triggers an alert. That is it. Twenty minutes of setup, then it runs forever.
Layer 2: Periodic health checks
Uptime tells you the site is reachable. It does not tell you the site is healthy. A site can return 200 OK while serving mixed content, leaking 503s on internal pages, missing meta titles, or shipping a 12-second LCP on mobile. You need something that scans the actual page, not just the HTTP response.
Run a weekly scheduled health check on every client site. Each scan covers performance, SEO, security headers, SSL configuration, and structured data. Compare the score against last week's. If anything regresses by more than a few points, get an alert. If everything is steady, no alert. Silence is the goal.
Our Studio plan handles this layer specifically. Bulk-add your client domains, set the cadence (weekly is usually right), and any score regression triggers a notification. The score history per site is stored so you can show clients a graph at quarterly reviews. See the good score sample for what a typical site report looks like.
Layer 3: Search visibility
The first two layers catch technical regressions. The third catches the slower-moving search problems: rankings drifting, pages dropping out of the index, manual actions in Search Console. Google Search Console is free and the single best source of this data. The friction is checking 15 separate Search Console accounts.
Two options: either set up a free Google Looker Studio dashboard that pulls all your client Search Console accounts into one view (an afternoon's work, then free forever), or use a paid tool like Ahrefs or SEMrush if your agency budget supports it. For an agency under 20 sites, Looker Studio is the right answer.
The Friday afternoon ritual
With all three layers wired up, your weekly review takes about 20 minutes:
- Check the Slack channel for any alerts from the past week. Most weeks, there are none.
- Open the health-monitoring dashboard and skim the score trend. Anything dropping, click in. Anything stable, move on.
- Open Looker Studio and skim Search Console traffic. Any client losing significant traffic gets a deeper look on Monday.
That is the whole job. The work that used to be a Friday afternoon of clicking through 15 cPanel logins and 15 Search Console properties is now triage, and you only dig in where the data says something has changed.
What changes for the client
The visible difference is that you start noticing issues before they do. The site that lost its SSL on a Tuesday gets fixed by Wednesday morning, before they email you on Friday. The blog post that uploaded a giant image and tanked the homepage LCP gets flagged on Saturday morning, fixed on Monday. The client's mental model of you shifts from "fixes things when we ask" to "watches our site for us". That is a different relationship, and it is the foundation of every retainer that lasts more than a year.
To try the second layer specifically, run a free scan on one of your client sites and see what the report looks like. The Studio plan handles the bulk monitoring across all of them.